Performance
If you navigate to the Performance tab you will find the current performance metrics for your transform.engine.
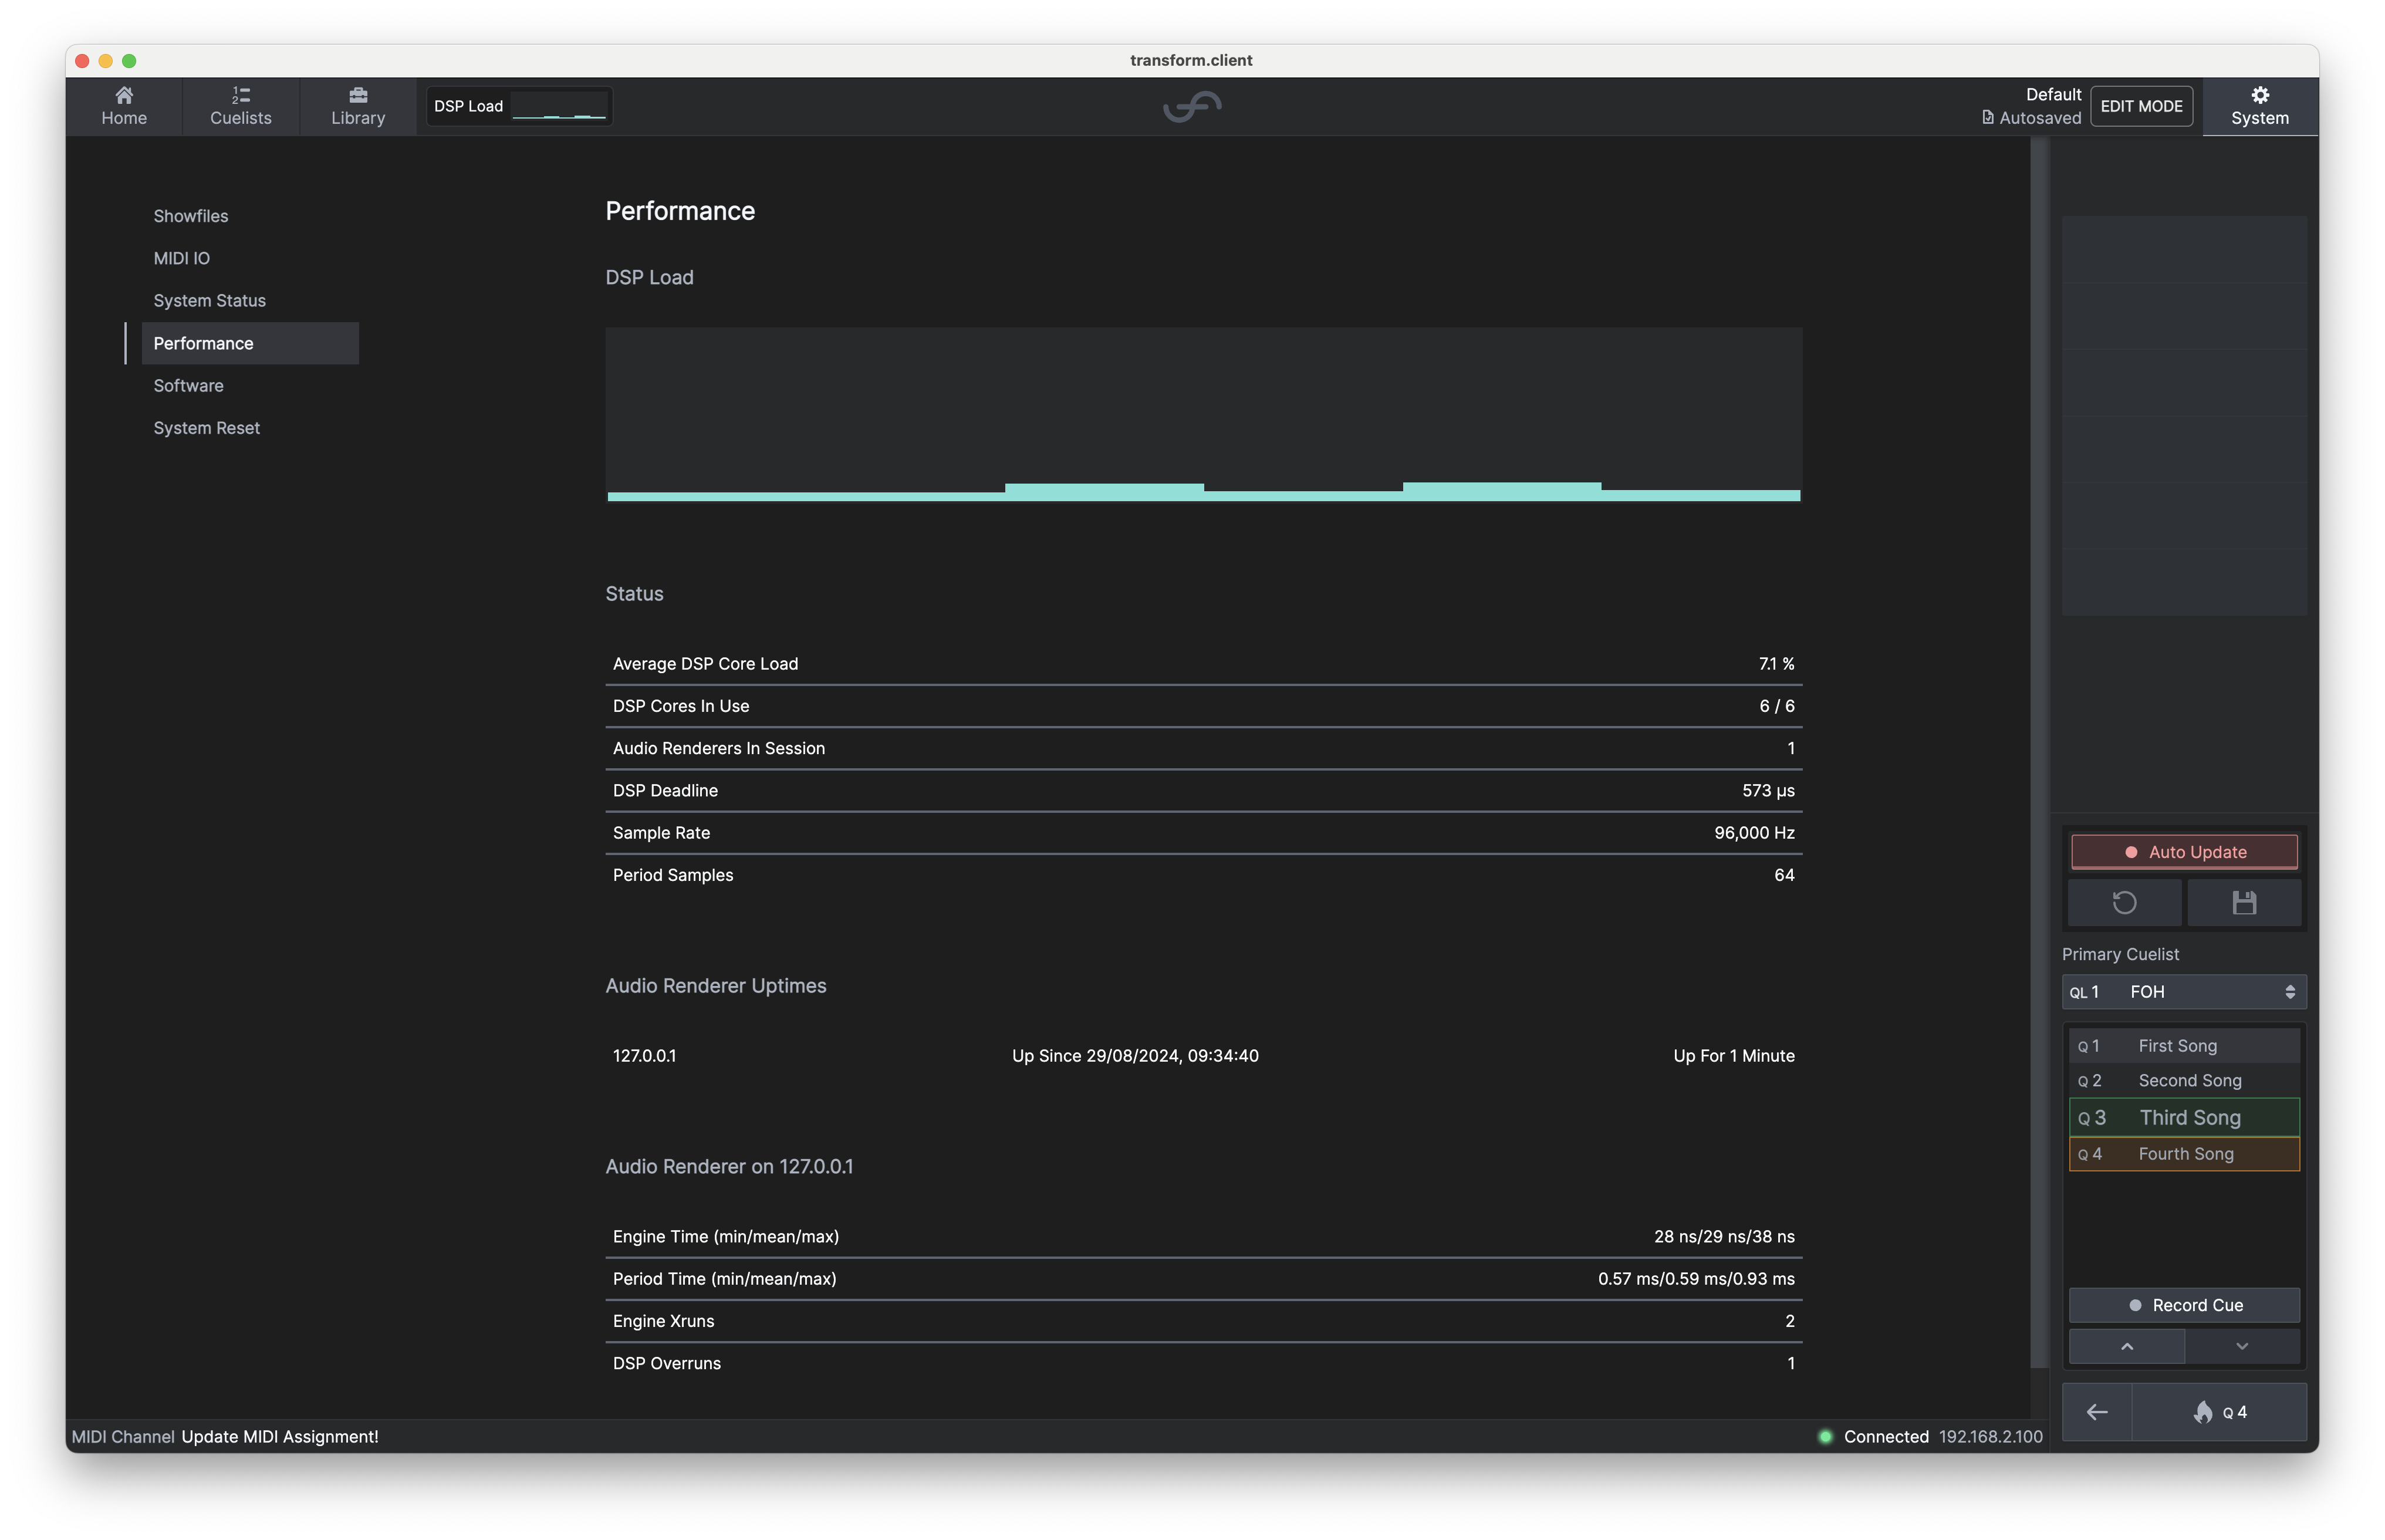
The chart shown (plus a smaller one in the top left) shows the load per DSP core.
Here you will also find other metrics such as:
- Average DSP Core Load - the average CPU % used across all active cores.
- DSP cores in use - the number of DSP cores currently available in the session, and their maximum utilisation.
- DSP Deadline - the time per period available to the system to process audio.
- Sample Rate - configured in Dante Controller, this is the audio sample rate that your transform.engine is running at.
- Period Samples - configured in the 'System Status' tab, this is the buffer size your showfile is configured to.
tip
By doubling the Period Samples from 32 to 64, you double the latency of the DSP pipeline, but you also increase the amount of time available (and therefore system capacity) to the chains for processing.
Audio Renderer Info
Below the whole-system information, information about the performance of each Audio Renderer in the system is displayed. A summary table shows the uptime of each Audio Renderer in the session, followed by detailed statistics for each renderer, mainly useful for support:
- Engine Time: The amount of time, per period, spent on internal engine audio processing tasks.
- Period Time: The inter-period time as measured from the Dante network.
- Engine Xruns: The count of occasions where time-skew was detected.
- DSP Overruns: The count of occasions where the requested audio processing took longer than the amount of time available (i.e. a DSP core was overloaded).